When Google created Chrome they had a few goals in mind, like having a powerful Javascript engine (the now famous V8), using the best browsing engine (WebKit) and even changing the typical version release flow so that we forget about browser versions and "just have the most recent one".
Clearly, one of them was to utterly destroy Firefox as a web developer tool, by providing with an all-in-one debugging suite. Without any external plugin (like Firefox and Firebug) you can develop or debug websites with ease.
General
The developer tools can be opened just by hitting F12. They are accessible from the menus too, but it's easier to just press the key. It opens on a per-tab basis, without sharing logs or network traffic analysis, and if you close the browser it won't reopen (unlike FFox's Firebug which remembers if it was open for a given domain).
By default the developer tools panel is docked to the bottom of the browser, but you can undock to a separate window if you want.
To avoid repeating the same a hundred times, whenever I say "edit" inside the dev tools panel, this has a lifespan of "until the next refresh". If you for example change some CSS, or remove an HTML, it will be reset if you click F5 or interact with the page in a manner that results in a refresh.
The console can be opened in most tabs too, but as it has its own I won't spend time explaining it until its time comes.
Also, all sections have a search bar at the top-right of the dev tools. This search is dependant (network traffic, DOM elements, script source code...) so remember that you can always search!
Elements section
In this view, at the left we have the HTML source view. We can easily navigate expanding and collapsing nodes, clicking on them shows at the bottom the tree hierarchy,
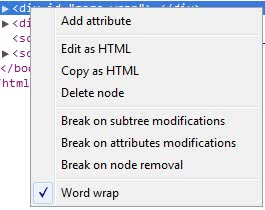
As you can see in the following screenshot, right-clicking on a node also allows you to do lots of interesting things, like watching DOM modifications or live editing attributes, the full node or even deleting it.

At the right side, we can see 6 tabs with a lot of info:
- CSS styles: Both the computed total attributes, and a hierarchy of where each one comes from. We can also add, remove and modify more CSS. The Metrics tab displays a visual "map" of the item dimensions, margins, paddings...
- Properties: Javascript object hierarchy of the selected node, displaying all attributes and going up to the top (to Object).
- DOM breakpoints: Those defined with the right-click menu. We can disable or remove them from here.
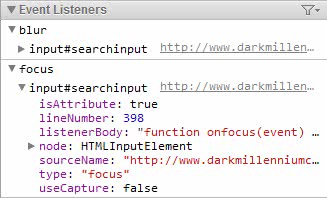
- Event Listeners: Another jewel. Displaying a list of all events attached to a given node, with some helpful properties and even the source code file and line number where it was attached from.

Resources section
This view allows to see data related with data storage.
The Frames node contains all data per frame of the tab: HTML source code, CSS stylesheets, script files and images.
The Cookies node contains all cookies fetched in the tab, and we can tamper with them or even delete them if we wish.
Local Storage and Session Storage display all Web Storage data with simple key/value lists. And we also have Application cache and Databases sections, although their use is more dependant of specific needs.
Network section
To use the Network panel, remember to either have the developer tools open before loading the page, or refreshing it, so that it can capture all requests.
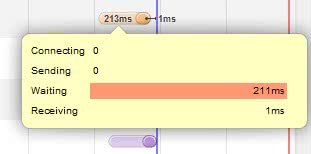
This view provides realtime network traffic data, from the HTTP method used or response status, to the response type, size, latency, or even impressive details of the time spent:

All of this while being able to filter by type, search or even "preserve" (lock so that even after a refresh the list doesn't empties).
Scripts section
The Javascript source view. From here we can check all javascript, and by all I mean included JS files, script blocks (tagged "(program)" and by source HTML file), and external JS files (for example those loaded in an iframe).
We can filter per file, add watch expressions, check the call stack when we hit a breakpoint, see scope variables, and even debug worker threads.
Supported breakpoints are: DOM, XHR, Event listeners and "normal" ones (those added to javascript code lines).
And two (sadly exclusive) last things we can do are Pretty Print and Edit.
Pretty Print allows to format javascript code, easing the hell of debugging a minimized 1 line huge file.
Edit allows to directly modify the javascript code (awesome for trying a bugfix without re-deploying code!), but the caveat is that if you pretty-printed it you cannot edit.
Timeline section
This view serves as a nice Javascript helper. You just click record, and do whatever you want to analyze.
You will get all events, reflows/repaints/recalculations, and some non-JS events like resource loading (because they usually matter, but you can filter them out). It also shows a timeline of memory consumption.
As you can see in the following screenshot, the amount of details given for each event are great. In fact you can notice strange Chrome extension behaviours, like installing a timer for the AdBlock extension when I have the analyzed webpage whitelisted (and thus it should just be ignored).

Most events allow to unfold/expand them into even more detail (e.g.: before load event, function call to load resource, evaluate JS, evaluate context in which it was triggered to load...). As you might have noticed by now, this is almost like working with any other compiled language (remember that modern browsers actually compile Javascript instead of pure script parsing and execution).
Profiles section
Imagine you have a Javascript memory leak. Imagine you are not sure where to start looking for it, and you have lots of javascript. The Profiles view is your solution.
Click record, perform a few operations in a suspicious section, click again and there you have, a nice profiling report of what consumed most time (in absolute totals or real usage milliseconds).
But let's say some of the results appear ok, and you are handling for example mousemove or other events that generate many events, and yet is not the leaking problem.
Then the "eye" button allows to do a Heap snapshot. Click to take one snapshot. Do something in the page (for example if suspicious about a photo slideshow load a few photos), and click again to have a second snapshot.
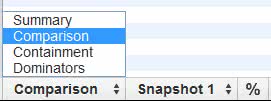
Go to the second snapshot, and in the lower part of the bar select "Comparison", like in this screenshot:

Now we have a nice treelist of objects, functions and special structures (like closures), with number of items added, deleted, creation/deletion delta (difference between created and deleted, memory consumed, memory freed and memory consumption delta.
Again we can expand the nodes and see up to the point of each compiled array and its internal values.
And with just one snapsot you can check the shallow size (memory held by an object itself), retained size (total memory that will be freed when the object is is deleted), checking the heap, and the dominators (Garbage Collector-relevant hierarchy of objects).
Audit section
This section, along with the official Google's PageSpeed Chrome extension, allow to generate network and performance audits. While this audits won't cover all your possible site optimizations, they give general advices, specially regarding bandwidth, resource loading and caching.
It is worth to run it from time to time to check and improve some of the points it advices.
Console section
Well, up to this point, the only thing that remains to be able to do, is writing javascript code on the fly, no? And that's exactly what the Console does, allows both to write JS from scratch, or to operate with current page Javascript (calling JS functions, etc.).
It is context dependant, so if you setup a breakpoint you will have scope variables access, else you will have access to the global variables and objects, plus loaded javascripts.
It allows single or multi-line code, gives a really great output, and also serves to read and filter console.xxx() outputs.
Chrome's console is as powerful as Firebug's one, I've seen colleages writing full code blocks here due to the quickness of testing.
Bonus #1: Disabling the cache
Modern browsers tend to have very aggressive caches, and Chrome by far beats everyone else (I've noticed cache inconsistencies even between their own services, like Google+ profile photo and the avatar in the header bar of GMail). So the top #1 feature requested by every web developer was "how to clear or disable the browser cache".
Well, since a few versions, things can't be easier. At the lower right part of the developer tools there is a black gear icon, click it, and you will popup the settings, including the beloved "Disable cache" :)
Bonus #2: Modifying the User Agent String
From the same gear settings as in the disabling cache checkbox, just below it you can also override the user agent, very handy for initial testing of mobile versions, etc. You should always do testing with a proper emulator or real devices, but for the first stages is perfect and now you don't need any extension.
This has been just a basic introduction to Google debugging 101, if you want to deeply learn each option, I recommend you to read the Chrome Developer Tools documentation.
Note: At the time of writing this article, Chrome is at v17.0, just out from beta into the stable channel.
Tags: Development HTML Javascript Tools