One of my defects is that I always think there's room for improvement in everything. But time (and budget) is limited, so we always have to evaluate and decide when to stop improving to move to the next feature. This is why Service Packs and revisíons exist (apart from bug-fixing ;)
When developig ASP.NET applications, I have never worried too much about concepts as scalability further than the typical aspects: caching, locks, and such.
But at my current job, we develop services that have to scale as much as to serve a full continent (i.e: all Europe). We are starting to do some initial stress testings with nearly 300 requests per second against a single computer with an instance. And we're not a professional testing team, we're just "playing" with some tweaked clients and browsers.
So what we do is take different approaches, because optimizations and performance tuning can be done in all layers of our applications.
The first and usually most important one is the source code. We could write a book about .NET performance optimizations and we would have still missed a lot of topics, so I'll leave up to you to read something, like this MSDN article about general .NET optimizations, or this one about ASP.NET performance.
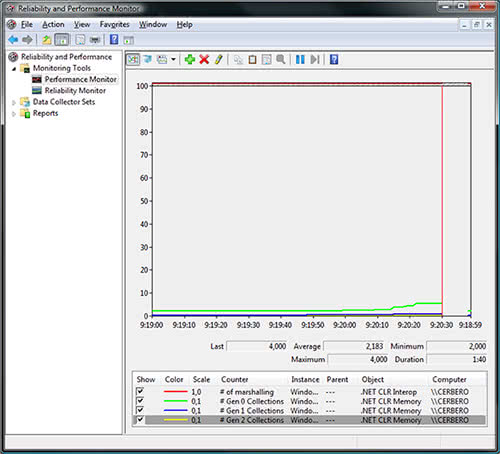
It is quite important to notice that you have to learn how to use things as the system performance monitor and its counters, because they can give you a lot of info about things like:
- How many requests per second is your ASP.NET application being able to server
- How much threads you've got created, idle, queued...
- How much memory you're consuming
- Garbage collector's performance
- I/O speed

Performance Monitor tracing an application's Garbage Collector and marshalling
A few interesting performance counters you can place for ASP.NET connections performance evaluation are the following:
- .NET CLR LocksAndThreads\# of current physical Threads
- ASP.NET Applications\Requests/Sec
- ASP.NET\Requests Current
- ASP.NET Applications\ Requests Timed Out
- ASP.NET\ Requests Queued
- ASP.NET\ Requests Rejected
- ASP.NET\ Requests Wait Time
- ASP.NET\Request Execution Time
One common pitfall I see often in .NET functions that are called once and again short periods of time is not using object pools. In game development this is quite usual (for example in a particle system, you can't create millions of particles once and again at least 30 times per second and expect it to be fast!), but in desktop/web applications it is easily forgotten that instancing an object and releasing it has a computational cost higher than having an array or collection of already-created items and changing their state (if you're using C++ think of two linked lists, one of "available objects" and other of "in-use objects", and moving the elements from one list to the other).
Another important aspect is to take care of ASP.NET SessionState in web services. Usually web services don't need to store any sessionstate (we just call them with specific parameters and process their results, no need for them to remember "us"). So be sure to check that none of your web services has it enabled. Also, if you have some aspx page that acts as a web service (for example serving a binary image) make sure the @Page element has the attributes sessionstate and viewstate set to false.
Anyway, as I said we could write an entire book, so just take in mind that performance not always means "small code" but other things like "efficient object and memory usage".
But after you've checked the code, you're not done yet. Recently we faced a problem: We had a quite good hardware server, our code was quite fast returning results in one web service method (between instant and 100 milliseconds per request), but anyway we were having the feel of only supporting 10-12 simultaneous requests, as if the calls were serialized.
Where could the problem be? easy... on the server's configuration. We were told that the firewall and networking were quite capable of handling a lot more traffic than a few dozen requests per second, so it wasn't the network. What about .NET configuration on the machine?
After digging a bit, my boss found this KB article. We checked our machine.config (usually placed at c:\{windir}\Microsoft.NET\Framework\{Version Number}\CONFIG\) settings, and found that we had found the problem's source: We had ASP.NET configured to have too few concurrent requests, connections and worker threads...
We modified it, and it was like magic... 287 requests per second using a single CPU for worker threads, and we could probably support more if we had the resources to make more concurrent connections!
So, remember to check your .NET configuration! By default it is not configured for intense concurrent use!
Extra #1
How to tweak your Firefox and Internet Explorer browsers to increase the maximum concurrent requests they can do to a single site (to simulate dozens of users at once). Keep in mind that this won't improve much your normal internet surfing (it can even degrade it).
Firefox
- Type "about:config" into the address bar and press enter.
- Modify "network.http.pipelining" to "true"
- Modify "network.http.proxy.pipelining" to true
- Modify "network.http.pipelining.maxrequests" to "30"
- Close and restart Firefox
Internet Explorer
- Open the Registry editor
- Navigate to "HKEY_CURRENT_USER\Software\Microsoft\Windows\CurrentVersion\Internet Settings"
- New "DWORD" value (if didn't exist before), name "MaxConnectionsPerServer"
- Edit it and set to (Decimal value), "30"
- New "DWORD" value (if didn't exist before), name "MaxConnectionsPer1_0Server"
- Edit it and set to (Decimal value), "30"
- Exit RegEdit and restart your IE
Extra #2
I highly recommend reading this pdf book (link dead) about .NET applications performance and scalability. It is a bit outdated (.NET 1.1) but most of the tips are vital and still valid ones.