I've been using Feedburner for a few years to keep track of RSS statistics (and as a proxy to be able to move my blog without feed readers being affected).
Until last week, I used a third party free tool, Feed Analysis, to show a graph of the stats of all blogs in Kartones.Net. But after Google bought Feedburner, I decided to migrate the account to Google, and that tool stopped working.
I knew the existence of Feedburner's Awareness API before, but hadn't touched it because I don't know Flash or any other way of creating a stats chart easily.
Recently, Microsoft released the new ASP.NET Charting Control, and I went the "do it yourself" way of implementing my own stats using it.
I requested an upgrade of my hosting provider to ASP.NET 3.5 SP1 + installing the chart control (it's a bit dumb to force you to install it instead of deploying an assembly, but ok, I can live with that), and started developing the "chart" page that would display the stats.
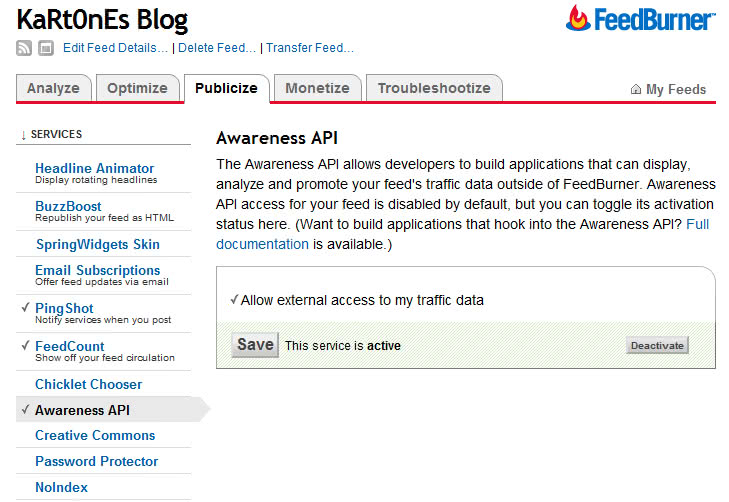
First, accessing the Feedburner API. You have to activate it in each of your feeds configured in Feedburner:
Then, a simple HTTP Request + Response will fetch the results in XML (I will only list the important fragments of code, not all, and almost no error catchings):
 private const string feedburnerAPIURL =
    "https://feedburner.google.com/api/awareness/1.0/GetFeedData?uri={0}&dates={1},{2}"; ... HttpWebRequest request;
HttpWebResponse response;
string responseXMLString;

request = (HttpWebRequest)WebRequest.Create(
    string.Format(feedburnerAPIURL, feedURI, statsStartingDate, statsEndingDate));
request.Method = "GET";

... response = (HttpWebResponse)request.GetResponse();
StreamReader streamReader =
    new StreamReader(response.GetResponseStream(), Encoding.GetEncoding(1252));
responseXMLString = streamReader.ReadToEnd();
streamReader.Close();
response.Close(); ...
statsStartingDate and statsEndingDate must be in YYYY-MM-DD format.
We should then check that response code is OK:
 ... responseXML = new XmlDocument();
responseXML.Load(new StringReader(responseXMLString));
XmlNode node = responseXML.SelectSingleNode("/rsp");
return (node.Attributes.GetNamedItem("stat").Value == "ok"); ...
I store the opened XmlDocument for the actual stats entries parsing (to avoid reopening it).
I've built two tiny structs to store an individual entry and the list of entries (along with max. and min. values of each field). So I fill it:
 ... XmlNodeList entries = responseXML.SelectNodes("/rsp/feed/entry");

results.Entries = new FeedburnerEntry[entries.Count];
for (int index = 0; index < entries.Count; index++)
{
    results.Entries[index].Date =
        DateTime.Parse(entries[index].Attributes.GetNamedItem("date").Value);

    results.Entries[index].Circulation =
        long.Parse(entries[index].Attributes.GetNamedItem("circulation").Value);

    results.Entries[index].Hits =
        long.Parse(entries[index].Attributes.GetNamedItem("hits").Value);

    results.Entries[index].Reach =
        long.Parse(entries[index].Attributes.GetNamedItem("reach").Value);
} ...
I won't go into details of creating a new chart, the samples are quite good for it, so I'll just point that a lot of configuration can be made in the markup definition of it (2D or 3D, transparency, colors, labels, data types...):
 <asp:Chart ID="feedChart" runat="server" Height="480" Width="640" BorderDashStyle="Solid"
    imagetype="Png" BorderWidth="1" BorderColor="#6F5F08" TextAntiAliasingQuality="Normal"
    Palette="BrightPastel" BackSecondaryColor="#FFFFFF" BackGradientStyle="TopBottom"
    backcolor="#DDDBC7" AntiAliasing="All" >
    <borderskin skinstyle="Emboss" />
    <legends>
        <asp:Legend IsTextAutoFit="False" Name="Default" BackColor="Transparent"
            BorderWidth="1" BorderColor="#000000" BorderDashStyle="Solid"
            Font="Trebuchet MS, 8.25pt, style=Bold" Alignment="Near" Docking="Bottom" />
        </legends>
        <series />
        <chartareas>
            <asp:ChartArea Name="chartArea" BorderColor="#404040"
                BackSecondaryColor="White" BackColor="96, 189, 182, 124"
                BackGradientStyle="TopBottom" Area3DStyle-Enable3D="true">
                <area3dstyle Rotation="10" Perspective="10" Enable3D="True"
                    LightStyle="Realistic" Inclination="10" PointDepth="200"
                    IsRightAngleAxes="False" WallWidth="0" IsClustered="False" />
                <axisy LineColor="32, 64, 64, 64" Interval="50">
                    <LabelStyle Font="Trebuchet MS, 8pt" />
                    <MajorGrid LineColor="32, 64, 64, 64" />
                </axisy>
                <axisx LineColor="32, 64, 64, 64" Title="Date" TitleAlignment="Center"
                    TitleFont="Trebuchet MS, 12pt" IntervalOffsetType="Days"
                    IntervalType="Days">
                    <LabelStyle Font="Trebuchet MS, 8pt" />
                    <MajorGrid LineColor="32, 64, 64, 64" />
                </axisx>
            </asp:ChartArea>
        </chartareas>
</asp:Chart>
The chart area is where the chart will be painted, and the series (which I leave empty because I fill define and fill it via code) are the groups of points (for example, a series can be one curved line plus one bar graph).
Filling the data at code is pretty easy too:
 FeedburnerEntryList feed = feedburnerFeed.GetEntries();

Series circulationGraph = new Series("circulation");
circulationGraph.ChartType = SeriesChartType.Spline;

...

Series hitsGraph = new Series("Hits");
hitsGraph.ChartType = SeriesChartType.Spline;

...

for (int index = 0; index < feed.Entries.Length; index++)
{
    circulationGraph.Points.AddXY(
        feed.Entries[index].Date,
        feed.Entries[index].Circulation);
    hitsGraph.Points.AddXY(
        feed.Entries[index].Date,
        feed.Entries[index].Hits);
}

feedChart.Series.Add(circulationGraph);
feedChart.Series.Add(hitsGraph);
And that's all... a fantastic graph appears:
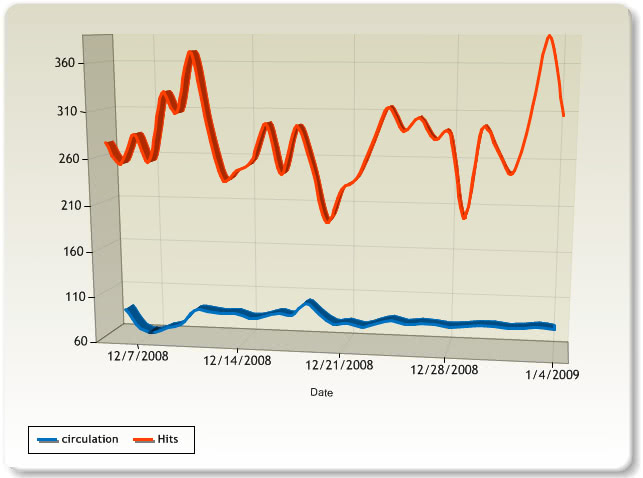
I still have to learn how to do some small details, but as anyone can see it is very very easy to use this new control.